Sonelastic® Software
Impulse Excitation Technique provides precise and accurate determination of the elastic moduli and damping of materials. However, it depends on a software to be practical and reliable. The software is responsible for the acoustic response acquisition, signal processing, frequencies detection and calculations. For this ATCP Physical Engineering developed Sonelastic® Software, released in 2010, is currently at version 6.0.
Screens of Sonelastic®, developed by ATCP Physical Engineering for the determination of the elastic moduli and damping of materials by Impulse Excitation Technique.
Elastic moduli
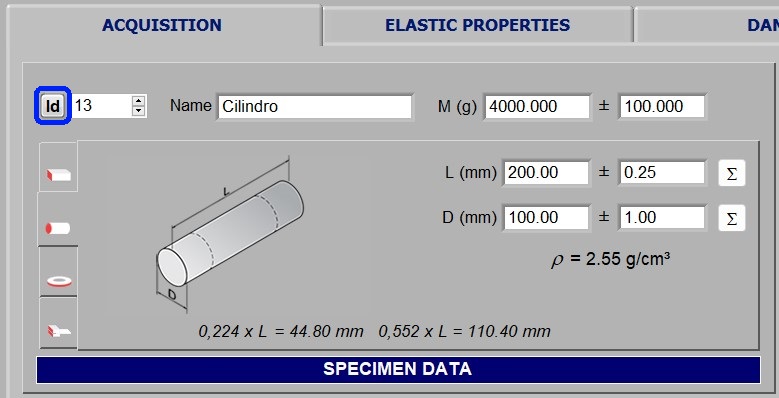
Sonelastic® Software is able to determine the elastic moduli of rectangular bars, cylinders, discs, rings and cantilever beams. For the calculations, it is necessary to inform the specimen mass, dimensions and respective uncertainties. For rectangular bars and cylinders, the software automatically calculates and reports the nodal lines position and spacing to facilitate specimen placement, as well as the bulk density and the point for simultaneous torsional and flexural excitation. The bulk or apparent density information is useful for the user to detect errors when entering the specimen dimensions and mass. The images below show the fields for selecting the specimen geometry and inserting data. For disc characterization, the ring option must be chosen and the internal diameter set to zero.
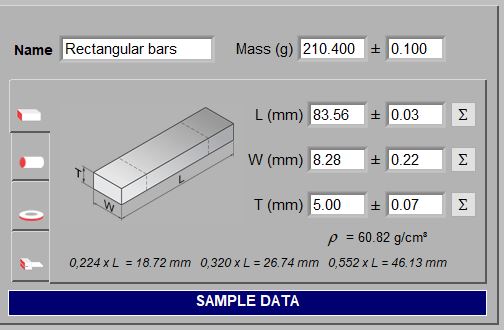
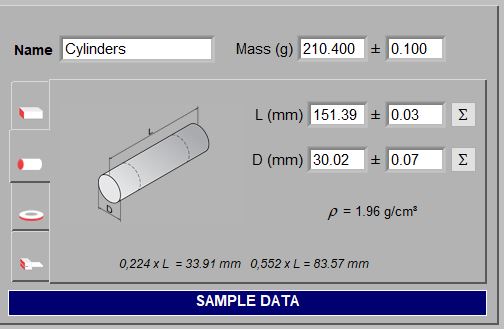
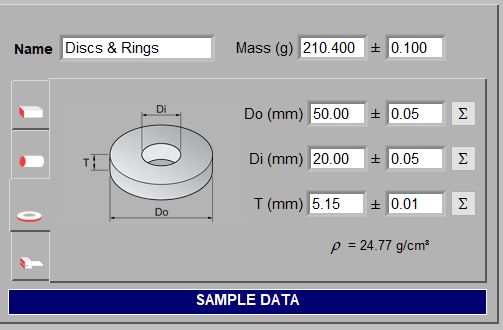
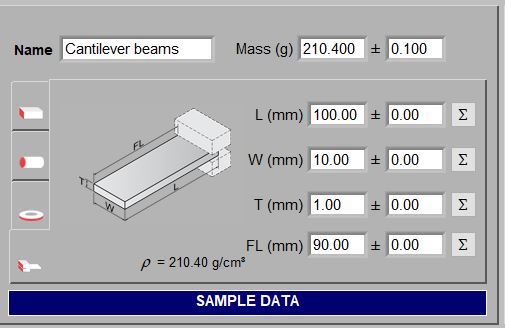
Sonelastic® fields for selecting specimen geometry and entering dimensions and mass. This information is necessary to calculate the elastic moduli.
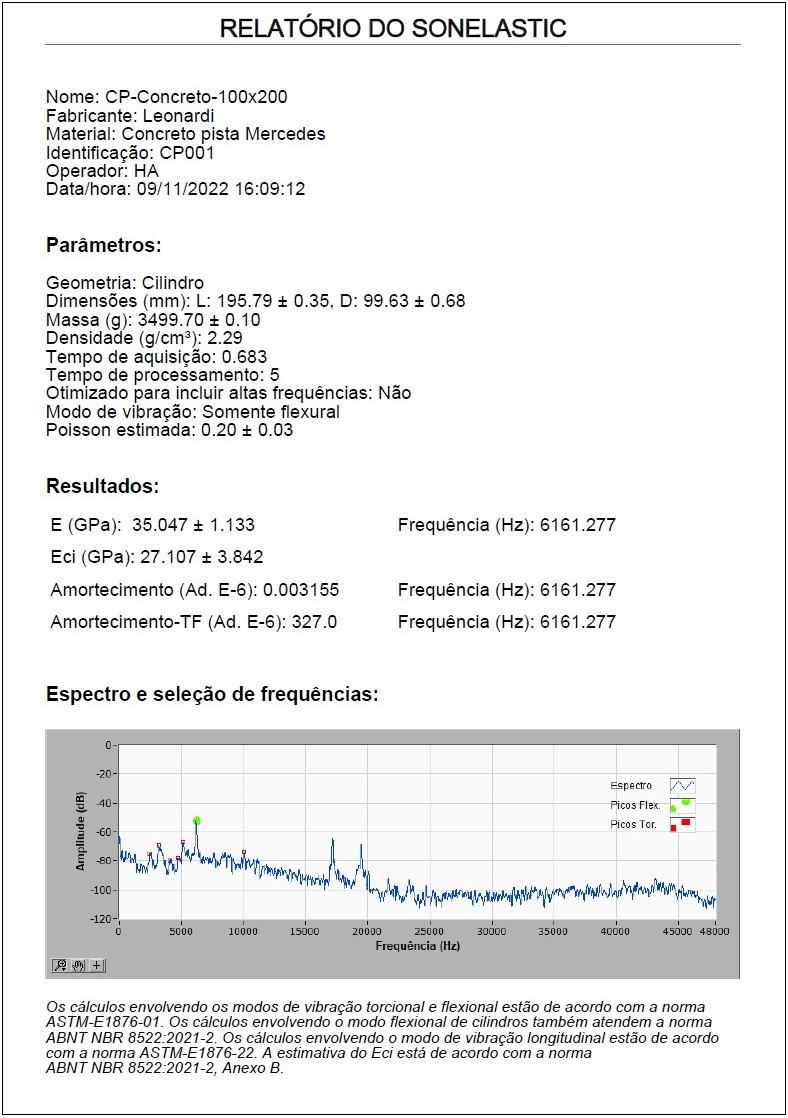
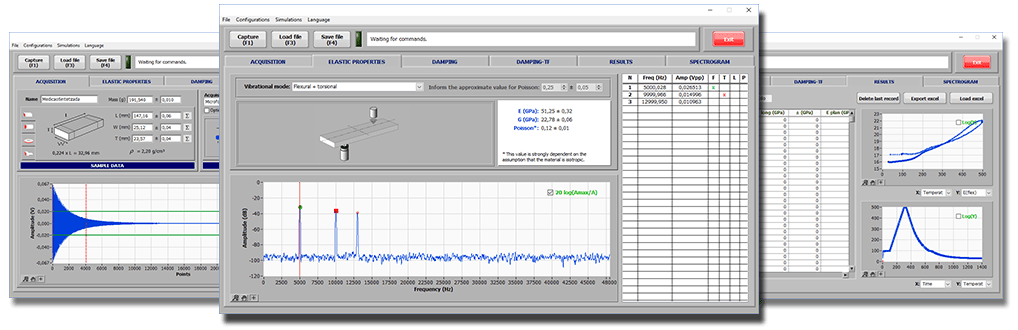
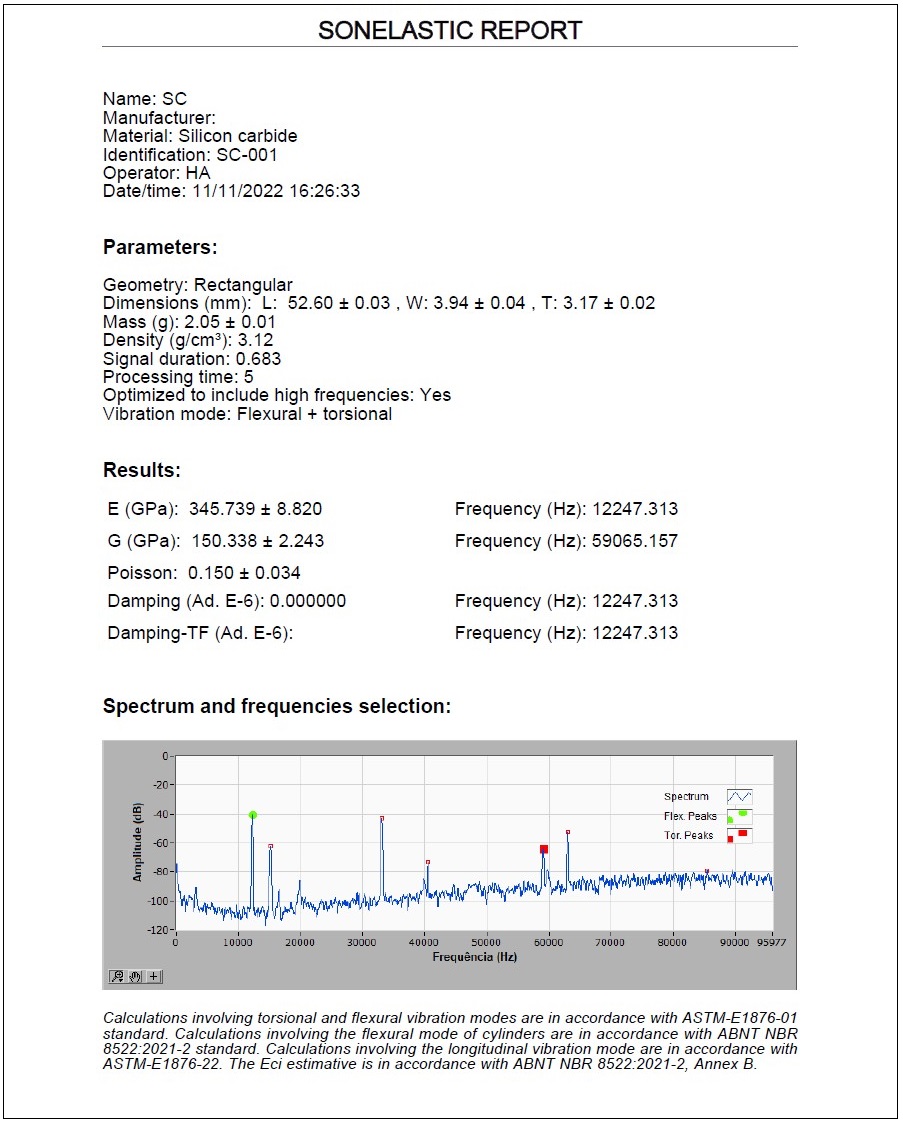
With the specimen data and after acoustic response processing, the software calculates the elastic moduli according to the vibration modes involved. For rectangular bars and cylinders, the shear modulus (G) is calculated with torsional mode frequency and Young's modulus (E) with flexural or longitudinal mode frequency. Poisson's coefficient (μ) is calculated from E and G. For tests with flexural or longitudinal mode only, the result is limited to Young's modulus. Discs, rings and cantilever beams are characterized in the flexural vibration mode and its possible to determine only the Young's modulus. The images below show examples of results reported on the software Elastic Properties tab.
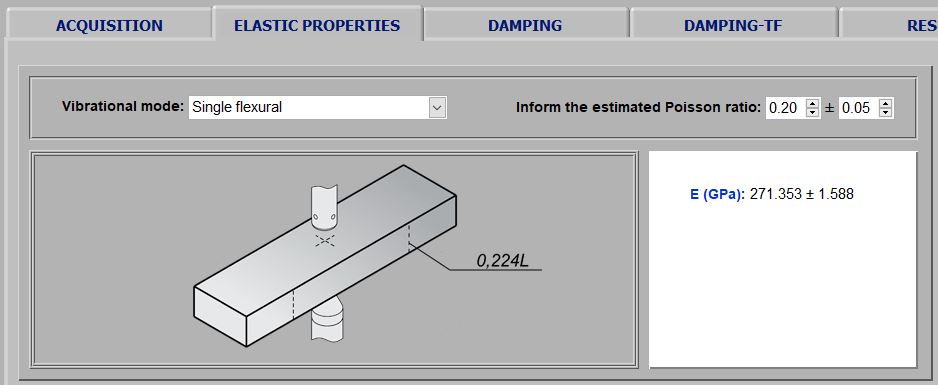
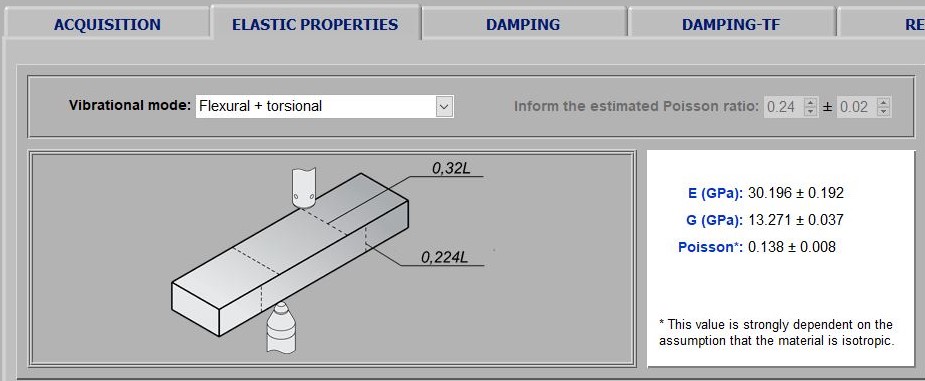
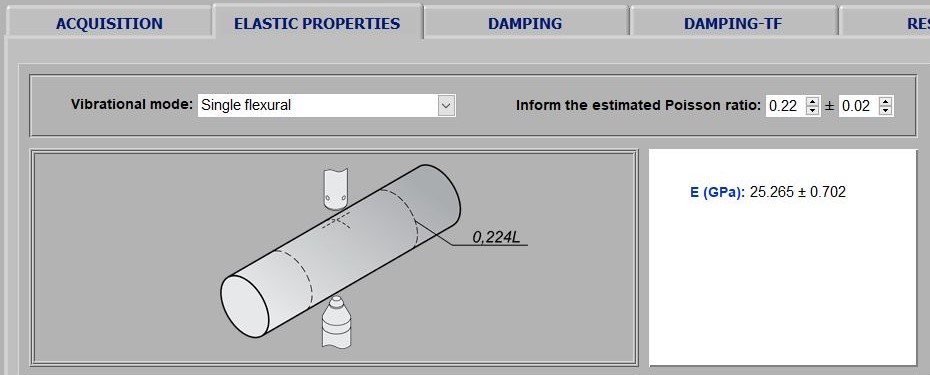
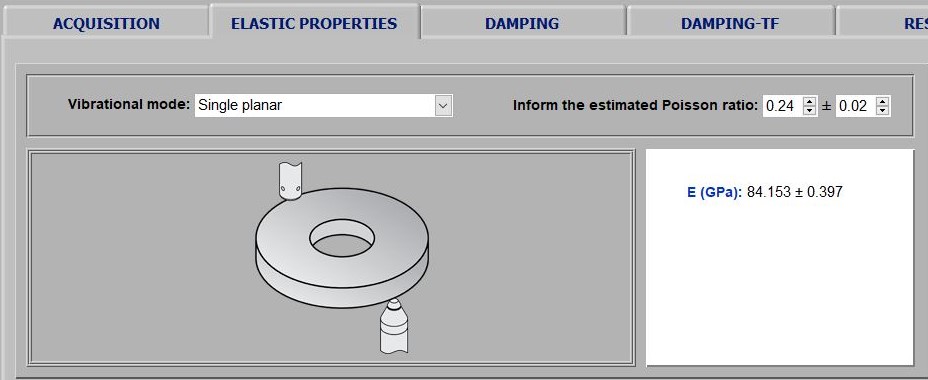
Results instances reported by Sonelastic® Software Elastic Properties tab. The first image is from a ceramic rectangular bar result, the second of a metallic rectangular bar, the third of a concrete specimen and the last of a piezoelectric ceramic ring (PZT-8).
The equations and algorithms used by the Sonelastic® Software depend on the specimen geometry; the main variables are the specimen frequencies, dimensions and mass. The table below lists the standards related to the equations used. Results uncertainty calculations are detailed in the software manual Appendix B.
References of the equations used by Sonelastic® Software.
| Geometry | Vibration modes | Reference |
| Cylinders | All | ASTM E1876-01 |
| Rectangular bars | Flexural and torsional | ASTM E1876-01 |
| Longitudinal | ASTM E1876-22 | |
| Cantilever beams | Flexural | ASTM E756-05 |
Sonelastic® Software is also capable of estimating the secant/chord modulus of concretes according to Popovics model.
Damping
The specimen acoustic response to impulse excitation contains two main information: the natural frequencies of vibration and the corresponding damping rates. When struck, the specimen emits sound for a finite time until vibration ceases due to the material damping. In addition to processing the acoustic response for frequencies identification, the Sonelastic® Software also obtains the respective attenuation rates for calculating the material's damping. To do so, it has two algorithms, the traditional exponential decay curve fitting of the time domain signal and an alternative, more sophisticated algorithm, that applies the exponential fitting to the frequency peak amplitude. The alternative algorithm has advantages when frequencies peaks are close. In the following images, two examples of damping determination for the same specimen are shown: the first image is by the traditional time domain curve fitting and the second one is by the frequency peak amplitude fitting algorithm.
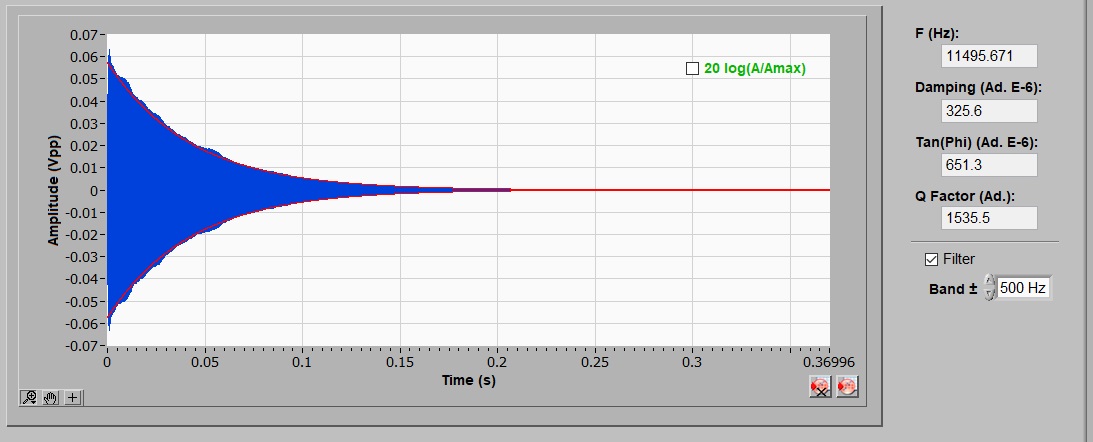
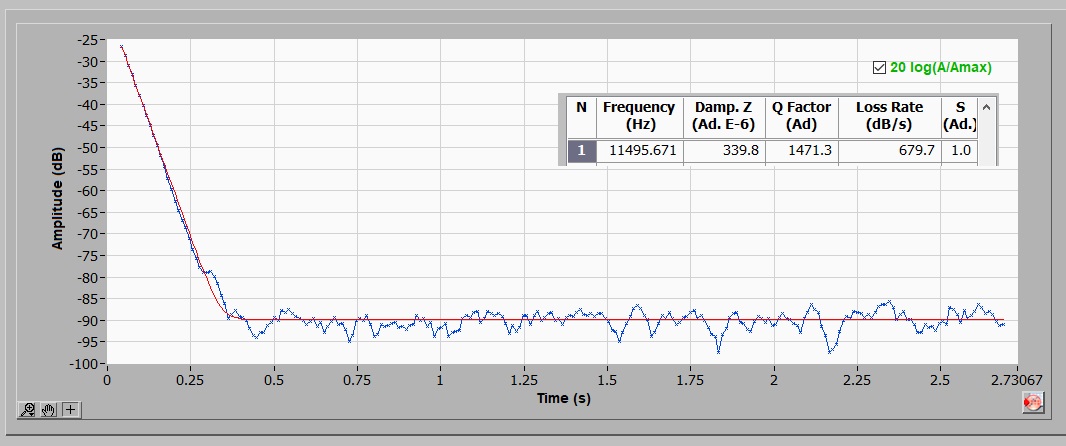
Results examples from Sonelastic® Damping and Damping TF tab. In the first image it is by the traditional method of exponential decay curve fitting in time domain and the second one is by the method of exponential decay curve fitting of the frequency peak amplitude (time-frequency domain).
P-waves and S-waves speed
Sonelastic® Software calculates the speed of P-waves and S-waves from the elastic moduli (Young's modulus, shear modulus and Poisson's coefficient). As the interest into this information is restricted to Geologists, its presentation along with elastic moduli results is optional and can be controlled by the user.
Frequency estimation
Sonelastic® Software has a frequency estimator to ease the correct identification of the torsional and longitudinal frequency, and also to specimens sizing. To use this feature, the user must know the material's Young's modulus order of magnitude.
The frequency selection to Young's modulus calculation is straightforward for rectangular bars and cylinders excited in flexural mode. In these cases, the spectrum is simple and the frequency is always the first relevant one and with the highest amplitude. However, the identification of flexural and longitudinal frequencies may be a challenge for slender rectangular bars due to harmonic frequencies. The figures below shown two examples of typical spectra: the first one is from a 200 x 100 mm cylindrical concrete specimen and the second one from an 83 x 8 x 5 mm ceramic specimen (ZTA). The cylinder spectrum contains only the flexural frequency while the ceramic bar spectrum has 10 relevant peaks. In the bar spectrum, the flexural frequency is also the first relevant one (marked with a green disc), but the torsional frequency is the seventh peak (marked with the red square) making the selection hard.
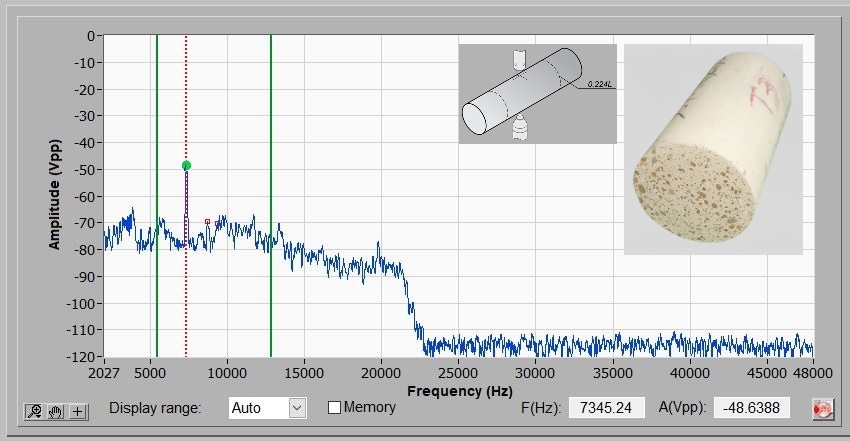
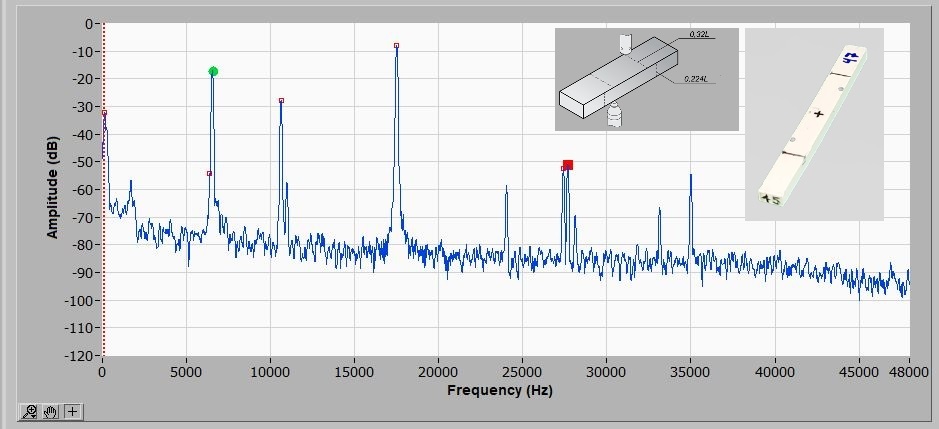
Examples of typical spectra for cylinders and slender bars. The first image shows the spectrum of a concrete specimen excited in flexural mode; the second image shows the spectrum of a slender ceramic bar excited simultaneously in flexural and torsional mode. The flexural frequency is always the first relevant one and is marked with a green disc in the spectra.
The next image shows the frequency estimation by Sonelastic® Software for a slender ceramic bar whose spectrum was shown in the second image of the previous image module. It was considered the approximate Young's modulus of 330 GPa and the Poisson ratio of 0.25. The estimation shows that the flexional frequency should be approximately 27 kHz, however, in this region of the graph there is a peak at 27.4 and another at 27.7 kHz. To identify which peak is the torsional one, the user must vary the boundary conditions, for example, excite and capture the acoustic response in the center (the peak that is the torsional will disappear because this is not a favorable boundary condition for this mode).
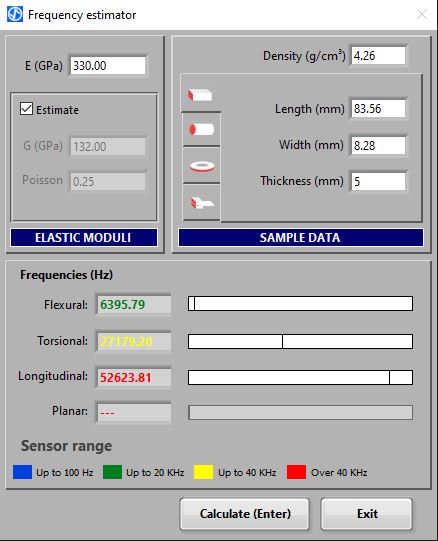
Sonelastic® Software window for estimating frequencies. This feature is useful for correctly identifying torsional and longitudinal frequencies, and for small specimens sizing to avoid frequencies go above the maximum measurable frequency.
The frequency estimator is also used in the specimens sizing. The smaller the specimen, the higher the frequencies. For high rigidity materials, the specimen frequency may go above the maximum measurable by the user's Sonelastic® System. This limit varies between 22.5 and 96 kHz, depending on the sampling rate of the module or system's signal acquisition board.
Automatic measurements in dependence of time and temperature
Sonelastic® Software has an operating mode for automatic measurements which allows to program the measurements number and interval. This feature is useful for monitoring curing processes and temperature-dependent characterizations. The following figure shows the configuration field for this operating mode.
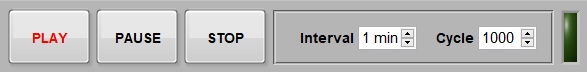
Sonelastic® Software fields for programming automatic measurements in dependence of time and temperature.
For correct frequency detection during automatic measurements, Sonelastic® Software has features such as programmable analysis ranges and adaptive excitation intensity. The software is capable of reading and saving temperature information along the measurements.
Results and curves export
The results provided by Impulse Excitation Technique and Sonelastic® Software are rich. For example, when characterizing rectangular bars the results include the time domain signal, frequency spectrum, frequencies list, elastic moduli, damping, temperature and acquisition time. The Sonelastic® Software is capable of exporting all these data to comma-spaced files (.csv format), which are friendly for importing and editing by MS Excel. It is also capable of generating test report in pdf format. The images below show Sonelastic® Software results spreadsheet and an acoustic response 3D spectrogram.
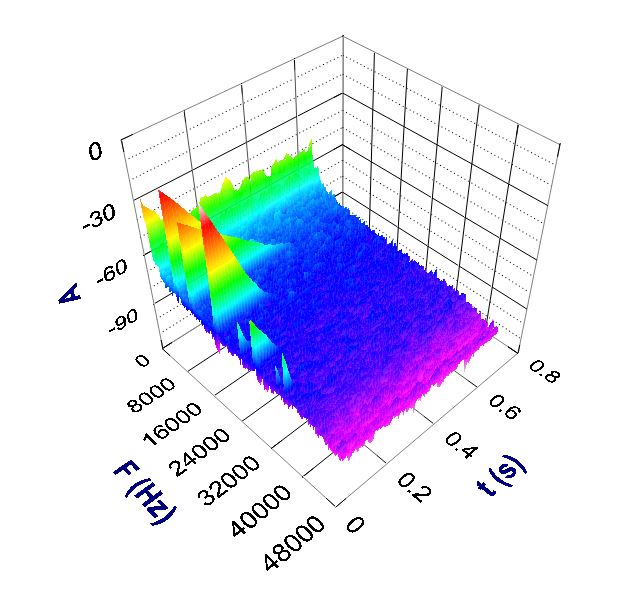
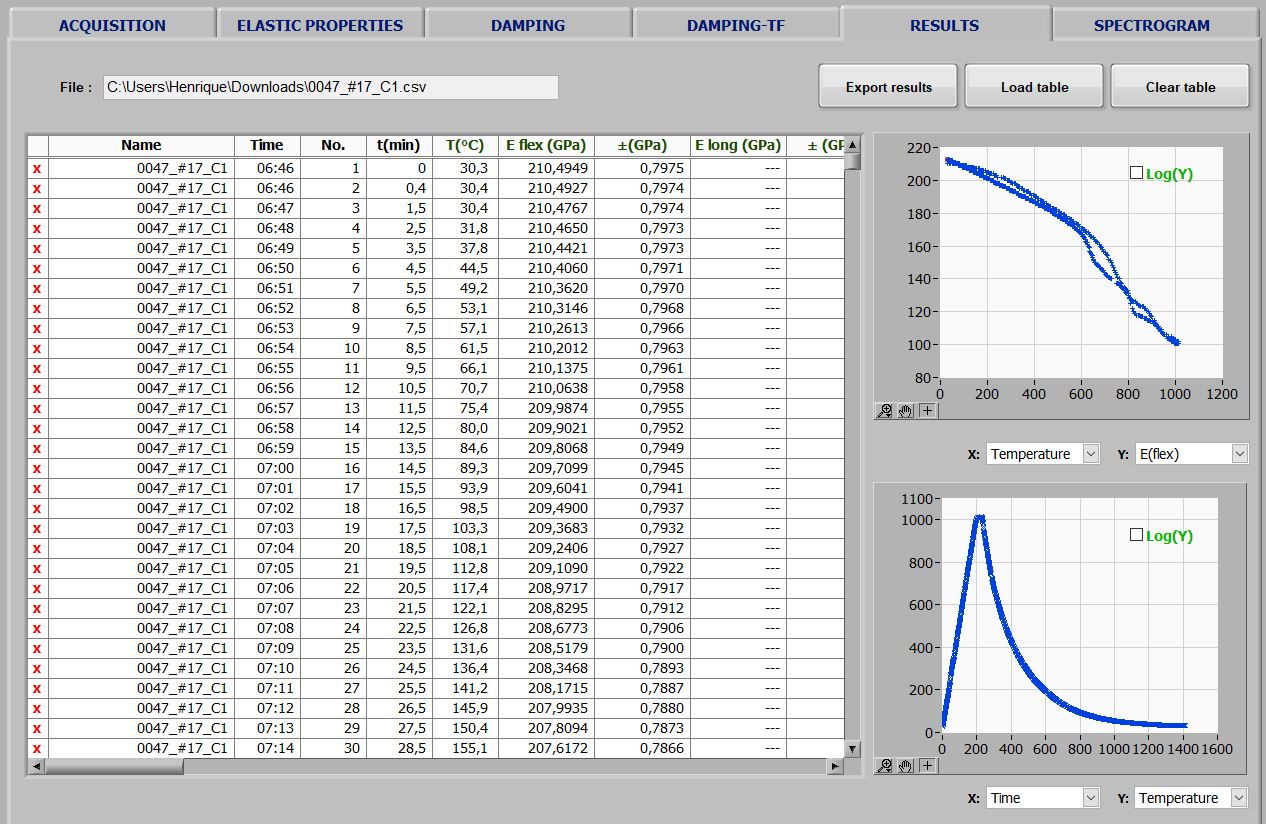
Examples of results provided by Sonelastic® Software. The first image shows an acoustic response 3D spectrum, the second one the spreadsheet and graphs of automatic measurements and the last one a test report.
In addition to csv files, the software is also capable of saving the measurements with acoustic response information embedded for eventual later reprocessing.
Specimen data entry
In order to make large numbers of tests faster, a module was incorporated in the Sonelastic® Software version 6.0 for anticipated data entry (dimensions and mass of the test specimens). The interface of this module and the access button located on the ACQUISITION tab are shown below.
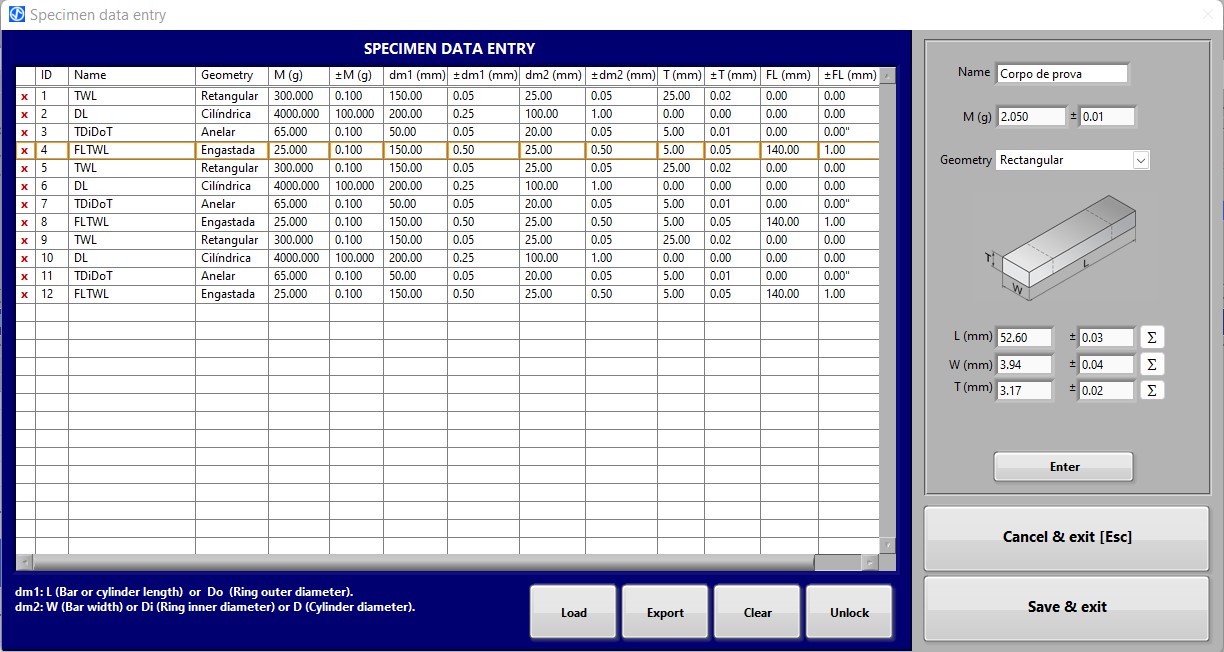
Specimen data entry.
Discover the Sonelastic® Systems:
Sonelastic® system for small specimensSonelastic® system for medium specimens
Sonelastic® system for large specimens
Sonelastic® Custom System and quotation